02/06/2023

Carbon Visibility

Understanding the financial risks and rewards of carbon calculations

Anna Reuttner, Sustainability Domain Expert and Jakob Muus, Sustainability Tribe Lead

06/02/2023 | 9 min

First, some sobering facts about carbon and why the industry needs Carbon Visibility. We are treating the planet’s air like an open sewer, trapping heat within the atmosphere of the same magnitude as 600,000 Hiroshima explosions every single day. We know we are near the point of no return – and we still don’t know what the full fateful consequences of our failure might be. The time to act was yesterday. 

It’s not a secret or a surprise that carbon measurement and reporting are clear business needs in the transportation sector: not only are customers expecting companies to take a lead, there are a whole raft of necessary regulatory and reporting mandates coming down the track, led by the EU’s Corporate Sustainability Reporting Directive (CSRD) and the Fit for 55 package of carbon reduction regulations. 

Less obvious – but perhaps more exciting to contemplate – is the scale of the business opportunity hidden within the current crisis. Nobel Peace Prize winner and US Vice President Al Gore describes a moment in which the scale of the Industrial Revolution will match the speed of the digital revolution to create one of the biggest business opportunities in world history – and that moment is now. 

Transporeon’s Carbon Visibility has been created to help you on that journey.

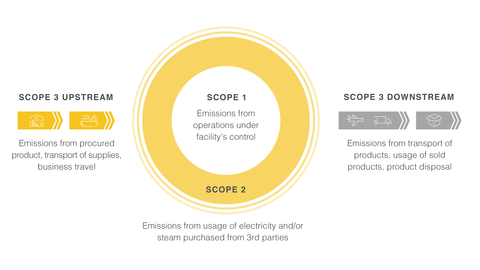
As emissions measuring and accounting methods begin to coalesce into an agreed standard, the industry is learning to group the complex spectrum under three key headings:

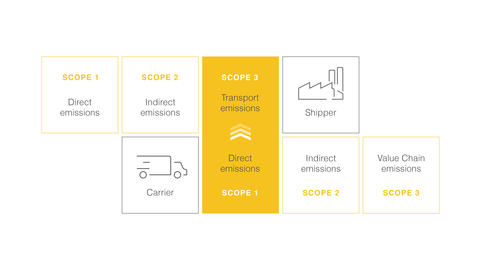
Scope 1: relating to the emissions your business has directly created and is responsible for.

Scope 2: emissions you are indirectly responsible for but which are essential to the running of your business. Example: what comes out of the chimney of your heat or electricity provider.

Scope 3: emissions created both upstream and downstream as a result of your business actions and requirements. Typical upstream examples include procured product, transport of supplies and business travel; downstream examples include transport of products, usage of sold products, and product disposal.

Seamless emissions management between shippers and carriers

Based on the above model, we can quickly identify that the Scope 1 emissions of a carrier may also be measured as the Scope 3 emissions of a shipper. At Transporeon, we sit in the middle between these two stakeholders, meaning we are ideally placed to support both parties in the collaboratively separating and aggregating emissions data.

As the industry embarks on this mission, it’s important to say first that the road to net zero is not necessarily straightforward. Think of it as a roundabout, a spiral of continuous improvement. Our view is that even from a small base, you can continue to improve, and you can become the climate champion of tomorrow. Carbon Visibility aims to help you not only make that leap, but also move further in your decarbonisation journey with primary data-based calculations and certified reporting. 

Because we at Transporeon support so many stakeholders along the supply chain, we can act as a fully centralised entity. One product, with one dashboard, catering to shippers, logistic service providers, and carriers, assigning data to the right parties to ensure seamless emissions management. 

Carbon Visibility is a fully automated SAAS and DAAS solution to measure, report and track all emissions via an inbound and outbound API to connect with your existing software systems. It counts scope 3 emissions for shippers and scope 1 emissions for carriers, and displays the data in different levels of granularity, right down to the shipment level. The tool enables precise Scope 3 accounting accredited by the Global Logistics Emissions Council (GLEC).

Overseen by the Smart Freight Centre, the GLEC Framework is considered the leading globally-recognised methodology for harmonised calculation and reporting of the logistics GHG footprint across the multi-modal supply chain. The Carbon Visibility tool fully meets GLEC standards and enables you to share all emissions with customers and partners as required. 

Carbon Visibility displays emissions findings via a single, easy-to-use dashboard, and the at-a-glance overview leverages a BI tool to allow a deeper dive into further data consolidation, breakdown and aggregation. Levels can be tracked via Lane, Carrier or Scheduling Unit, etc. This can reveal which players are the ‘greenest’ front runners, aiding decision-making about where to invest time and money. 

Financial savings

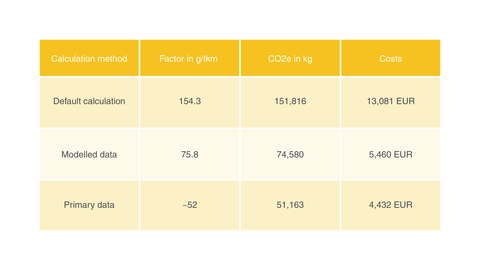
To illustrate the cost benefits of Carbon Visibility and the value of real versus presumed data, we ran a beta test on 117 shipments to calculate the difference on the three different data types defined by the GLEC framework – default, modelled and primary data. 

Bad data invariably means overcalculation, because the GLEC framework requires assumptions to be made on occasions when true, accurate data is not available. For instance, let’s say we’re looking for the data for a specific pallet. Because you do not have the true data on the type of vehicle used for the shipment, you have to use the default. You also will allocate measurements for that vehicle with the default assumption that it is making the return journey entirely empty, which might not be the case. In both scenarios, you will have to account for higher carbon figures than the true numbers, and that’s before you factor in the built-in error margins. In short, it’s a scenario that means you’re losing money. 

We know that the industry has not become accustomed to understanding the monetary values behind carbon data calculation, because the concept is so new. We haven’t learned to ‘speak carbon’ in the way that we can speak about dollars, euros or pounds. 

For our beta test example, we took the prevailing price of carbon futures on the day of the test, at €86 per metric tonne of CO2. Measured according to GLEC ‘default’ accounting, the average cost of the 117 shipments was €13. With modelled figures, it came in at €5.46, but the true value of primary data reduced the spend to €4.43, all in compliance with upcoming regulations. Consider the potential savings across thousands of annual shipments.

Accounting with primary data enables you to reduce the guesstimates, to measure accurately and to fine tune accordingly. It’s about a lot more than measuring – it is a roadmap to climate leadership. 

Highlights from our Q & A

How does Transporeon help to ensure carriers are prepared to share carrier data?

Jakob: One of the things we’ve heard speculated over the past four years on this journey is that carriers don’t want to share data for commercial privacy reasons, but the fact is that every time we ask them, they say yes.

Let’s say I’m a carrier. There are two ways to do it: send the shipper my fuel bills, which means they can now see my cost structure, which for obvious reasons I am uncomfortable with; or I can go to a trusted third party, who can calculate them independently of both of us, with no chance to reverse engineer my cost structure.

When carriers see we can help them with this automated solution, we get a very high success rate. Every time we onboard a shipper, we approach three of their carriers and they are near universally positive in their responses.

What is the financial impact on my business of using the tool?

Jakob: There are strong savings on two levels. First, you have accurate measurements of all emissions on your three Scopes, and of course Scope 3 in particular is complex and time-consuming to allocate without this tool. That’s where the automation comes in and it provides substantial savings in itself.

Second, we need to lower emissions, which means better emissions management. And you have to measure before you can manage effectively. Once you can do that, you can begin to optimise and it’s a question of how far you want to go. There is a huge amount to be saved in both carbon and money.

Are there any plans to use carbon visibility data to inform procurement decision-making?

Anna: It’s already possible specifically for your procurement positions, because we can aggregate all data at a separate carrier level. We are also working to embed it further in the future, so that you can see a predicted CO2 level before assigning the transport.

How do you accredit the data for sustainability reports and is there a compliance check?

Anna: It is very reliable, real and true primary data from various, provable and accepted sources, such as your TMS or the carrier’s telematics. It is accredited by the GLEC framework.

Can you calculate emissions in the tendering phase?

Anna: Not at this moment, but it’s on the roadmap. Meanwhile, you can view past emissions in specific lanes, so that provides some guidance.

How can Carbon Visibility support fleet owners to be more sustainable and win more business?

Anna: The sweet spot Transporeon sits in, an independent party between carriers and shippers, gives us the trust to be a reliable support. We’d encourage carriers to recognise the competitive advantages of being a green carrier. Enabling you as a carrier to have a precise record of emissions means you can work on a decarbonisation strategy alongside your shipper partners to make smart decisions together. Carbon Visibility aims to help you do that.

Do you provide a CO2 calculator on your homepage for customers?

Anna: Not yet, that’s another one for the future. For now we can have a one-to-one with your specific team, and we can very quickly and easily take a data set and show you what your dashboard might look like. We encourage you to contact us and we can begin the conversation, with no obligation to your business.

New platform solutions available now

Discover the new solutions and innovations that make Transporeon’s Transportation Management Platform your one stop shop to move, manage and monitor freight globally.

Get in touch to learn more about our new solutions: 

Want to learn more about our new solutions? Fill out the form below and we will get in touch to let you know how you can upgrade your business.

We need your consent to load the service “Marketo”!

We use the service of a third-party provider to embed and provide content. By clicking “Accept”, you consent to the data processing by Marketo. You can find out more about the service via “Settings”. You can revoke your consent at any time with effect for the future.

PRODUCTS

Explore our latest digital freight solutions

We debuted a collection of new products at TP Next. Find out more about our latest digital freight solutions and learn how our products work together in harmony to increase transport efficiency across the complete lifecycle of freight activities.

Dock & Yard Management Hub

Digital Transport Documents

Digital Transport Documents
  • Paperless management of the consignment note through all involved parties
  • Easy usage due to conveniently comment and signing of the eCMR on a mobile device
  • Provide the eCMR in real time via Transporeon platform plus additional communication channels

Transport Execution Hub

Transport Operations

Transport Operations
  • In one single, easy to use interface, logistics teams can manage FTL, LTL, groupage, and ocean flows like never before.
  • You no longer need to worry about manually finding and assigning the right shipment to the right carrier.
  • Full Visibility, Total Control.
  • Transport Operations uses smart, data-driven workflows to automate the whole transport execution and monitoring process.